
Every frame counts when you are deep in a high-stakes match or exploring a vast open world. However, the hardware powering those visuals is under constant thermal pressure. At Telespace, we understand that maintaining peak performance is just as much about software oversight as it is about the high-end components inside your chassis. Whether you are running a streamlined Econo Epic build or the titan-class Rev 9, keeping a watchful eye on your internal temperatures is the difference between a legendary session and a sudden system shutdown.
The Critical Thresholds
Understanding the numbers is the first step toward effective monitoring. Most modern CPUs and GPUs are designed to handle significant heat, but there are clear boundaries you should not cross. For a CPU, staying between 40°C and 70°C during gaming is generally considered the sweet spot. Once you start creeping toward 80°C or 90°C, your system may begin thermal throttling to protect itself.
GPUs often run a bit hotter, with many modern cards comfortably sitting between 65°C and 85°C under heavy load. If you notice your GPU temperature regularly exceeding 85°C, it might be time to look at your fan curves or airflow. When your hardware begins to stutter or the screen flickers unexpectedly, it is often a silent signal that the internal components are struggling to maintain their structural and operational integrity under heat.]=
Essential Tools for Real-Time Tracking
You do not need to be a technician to get professional-grade data on your PC’s health. Several free and lightweight applications provide real-time overlays so you can see your stats without Alt-Tabbing out of your game.
- MSI Afterburner: Widely regarded as the gold standard, this tool works with almost any GPU brand. It includes the RivaTuner Statistics Server, which allows you to display a customizable on-screen display (OSD) showing clock speeds, usage percentages, and, most importantly, temperatures.
- HWMonitor: If you prefer a detailed list of every sensor in your machine, HWMonitor provides a comprehensive breakdown. It tracks the minimum, maximum, and current temperatures of your CPU cores, GPU, and even your NVMe storage drives.
- NZXT CAM: For those who prioritize a clean, modern interface, CAM offers an easy-to-read dashboard. It is particularly useful for tracking historical data to see if your temperatures are rising over weeks or months.
Optimizing Your On-Screen Display
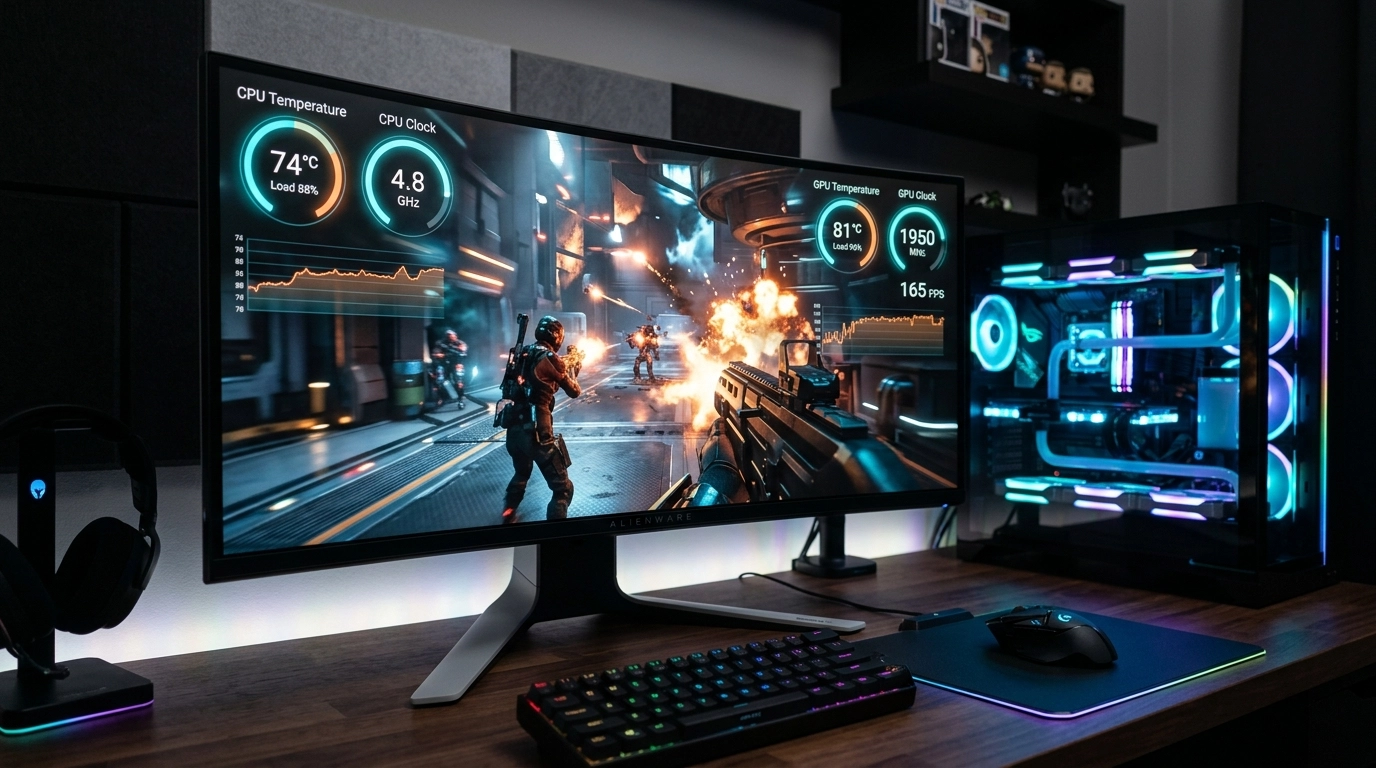
Setting up an overlay ensures you are never caught off guard by a heat spike. Inside MSI Afterburner, you can navigate to the “Monitoring” tab and select the specific sensors you want to track. By checking “Show in On-Screen Display,” these metrics will appear in the corner of your screen while you play. This allows you to correlate specific in-game events—like a massive explosion or entering a crowded city—with how your hardware reacts. Establishing a habit of checking these metrics helps you identify if a sudden drop in frame rates is caused by a software glitch or a more deep-seated hardware bottleneck that requires a manual inspection.
The Role of Physical Hardware
Monitoring is a diagnostic tool, but the solution to high heat often lies in the physical build. High-performance rigs like the Dilophosaurus utilize advanced cooling solutions, such as the Lian Li Galahad II TRINITY AIO, to move heat away from the processor efficiently. If your software shows high CPU temps despite low usage, the issue might be the thermal interface or the pump speed of your cooler.
Airflow is the other half of the equation. Cases like the Antec AX61 Elite or the Thermaltake Core P3 are designed with specific thermal paths. If your GPU is running hot, ensure that the intake fans are not obstructed and that the exhaust fans are successfully pushing the warm air out of the rear and top of the case.
Decoding the Data
What do you do when the numbers look wrong? If your monitoring software shows an “idle” temperature (the temp when you are just on the desktop) above 50°C, something is likely obstructing your cooling. This could be background processes hogging resources or physical dust buildup. Consistently clearing away the microscopic debris that accumulates on fan blades and heat sinks is the most effective way to ensure the air actually reaches the components it is meant to cool.
If your temperatures look fine but you are still experiencing crashes, you can look at the “Hot Spot” temperature on your GPU. This is often 10-15°C higher than the average temperature and provides a more accurate picture of the most stressed part of the silicon.
Sustaining Your Peak Performance
Monitoring your CPU and GPU is not a one-time task but a part of a healthy gaming routine. By using tools like MSI Afterburner or HWMonitor, you gain the insight needed to protect your investment and ensure your gameplay remains fluid. At Telespace, we take pride in assembling systems that are built to handle the heat, from carefully selected thermal paste to optimized fan configurations. We provide the foundation for an elite experience, and with the right monitoring habits, you can keep your system running at its absolute best for years to come.